Structured Intelligence
for Critical Industries
Our detailed Market Graphs provide in-depth insights into production facilities, business relationships, expansion plans, and more - bringing an unparalleled level of transparency to critical industries worldwide.


Our Market Graph Platform
Lorem ipsum dolor sit amet consectetur. Diam fringilla elit sit mauris pellentesque est ut lobortis. Risus adipiscing pharetra nisi ac urna. Proin enim viverra.

Analyze Ownership and Business Relations
Our Market Graphs allow you to identify and analyze supplier relations, partnerships, conflicts and indirect control between organizations. This way you can spot business opportunities or identify potentially compromised actors within a supply chain.
R&D Projects, Acquisitions, Partnerships and more
We track the activities of all relevant players within a market so you can easily track your competition, find new angles of innovation or generate sales signals for your business.

Detailed Data on Company Facilities
Most existing data sets contain registered company addresses at best. We go beyond that and provide detailed insights on all the existing and planned facilities of an organization, including factories, R&D centers, offices and more.

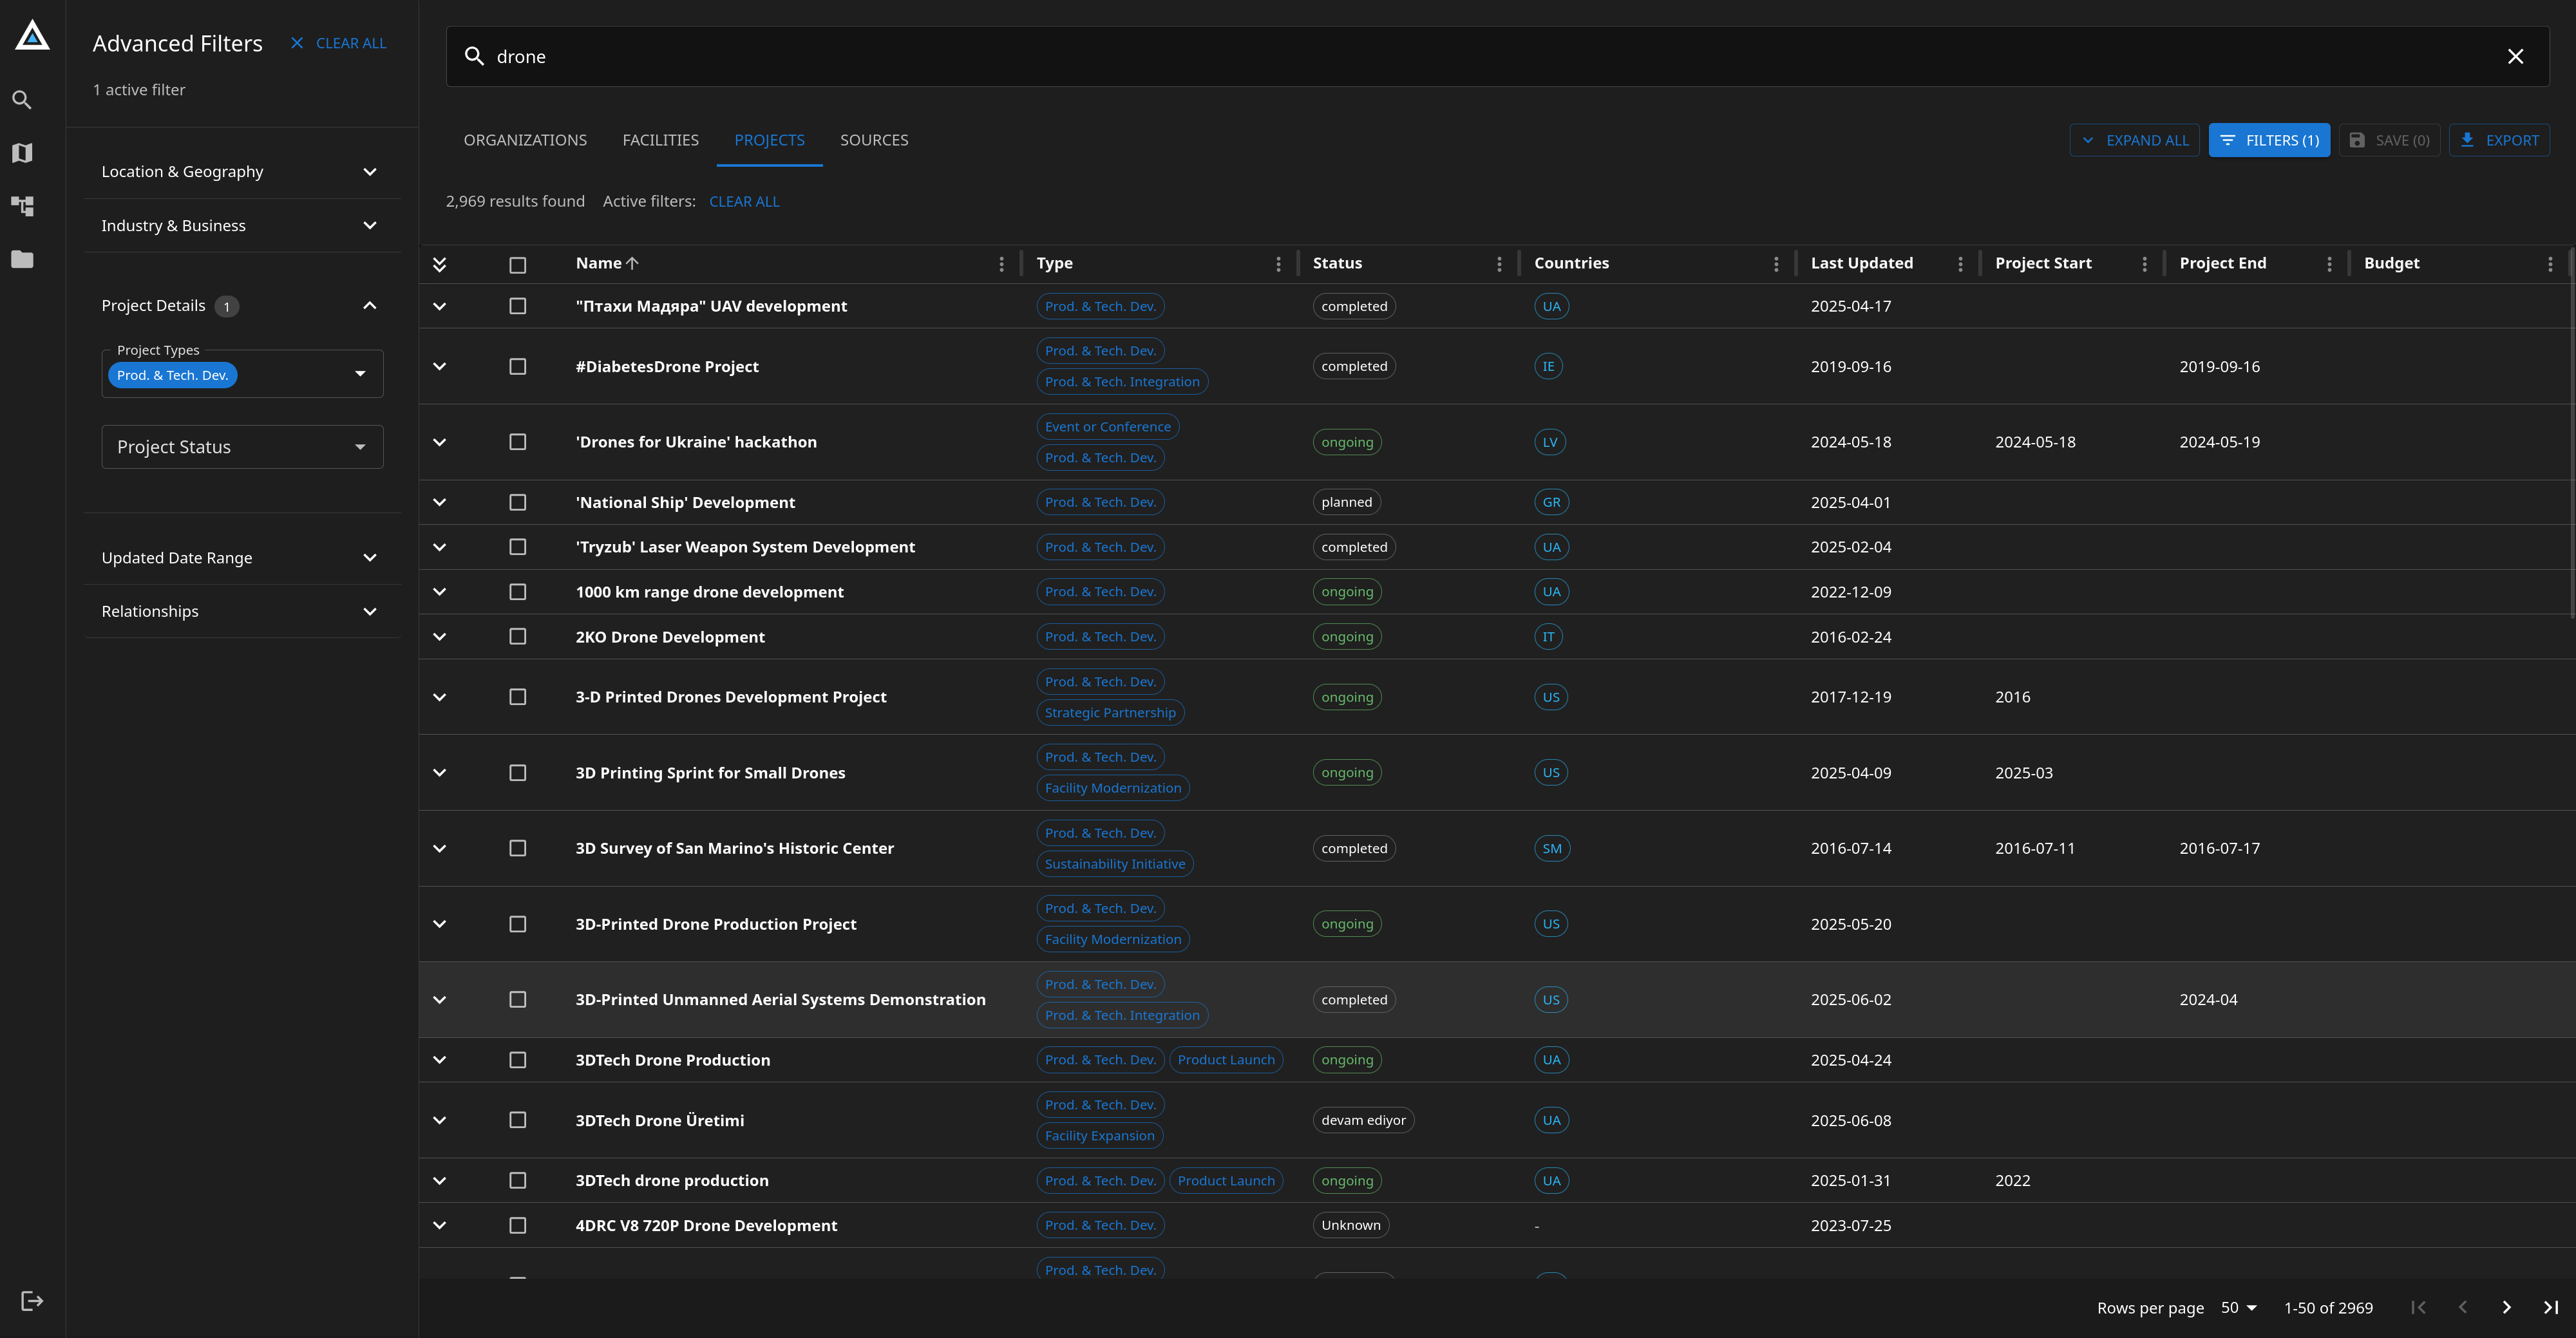
Discover our Defense Market Graph

Due to geopolitical shifts and an increasing number of military conflicts worldwide, defense has become one of the most critical industries. No matter if you are already established in the defense sector, shifting your focus from a different direction to the industry or are monitoring the market as a government institution - our Defense Market Graph gives you detailed insights about relevant players and recent developments.


How it works
Data Acquisition
We start by gathering all kinds of different sources - especially information-rich, unstructured public documents.
Entity & Relation Extraction
In a complex pipeline we extract relevant entities like organizations, facilities or projects and the relations between those.
Graph Construction
Ultimately we combine the entities and relations from millions of sources into consistent knowledge graphs that are constantly updated.